The Road to Chattanooga
IRONMAN 70.3
Chattanooga
70.3 Miles. One Finish Line.
May 16, 2027 · Chattanooga, Tennessee
Primary Goal: Podium finish (Top 3) — M35–39
Register for the Race
Race Day
--
Days
--
Hours
--
Minutes
--
Seconds
Race
IRONMAN 70.3 Chattanooga
May 16, 2027
Division
M35–39
Primary Goal
Top 3 / Podium
Target Finish
4:05:00–4:15:00
Recent Benchmark
4:16:00
2026 M35–39 winner
This race is one part of The $70K Mission.
See the Bigger Mission →The Goal
What Does a Podium Take?
Not just a finish — a placement goal, backed by what recent-year age-group podium finishers at this race have actually run.
Swim
Target
≤29:00
~1:22–1:25 per 100 yd
Bike
Target
≤2:15:00
~24.9+ mph
Run
Target
≤1:20:00
~6:06 per mi
Transitions
Target
5:00 or less combined
Finish
Target
4:05:00–4:15:00
Targets based on recent M35–39 results at IRONMAN 70.3 Chattanooga.
See the Benchmark Data
Swim
Current
1:58/100 yd training pace (not race effort)
Next Milestone
30:00–32:00
Podium Target
≤29:00 (~1:22–1:25 per 100 yd)
Bike
Current
12.8 mph · 12.28 mi · 276 ft gain · 148 bpm avg HR
Next Milestone
2:20:00–2:25:00 (23.1–24.0 mph)
Podium Target
≤2:15:00 (~24.9+ mph)
Run
Current
TBD
Next Milestone
1:25:00–1:30:00 (6:29–6:52 per mi)
Podium Target
≤1:20:00 (~6:06 per mi)
Transitions
Current
TBD
Next Milestone
6:00 or less combined
Podium Target
5:00 or less combined
M35–39 Age Group
Podium.
M35–39.
Podium finish (Top 3)
Target Finish
4:05:00–4:15:00
| Split | Historical Winning Range | Current Benchmark | Next Target | Podium Target |
|---|---|---|---|---|
| Overall finish | 4:04:51–4:27:25 (2023 top-9); 2025 not directly comparable — no swim leg held | TBD | 4:15:00–4:25:00 | 4:05:00–4:15:00 |
| Swim (1.2 mi) | 28:19 (2023 winner) | 1:58/100 yd training pace (not race effort) | 30:00–32:00 | ≤29:00 (~1:22–1:25 per 100 yd) |
| Bike (56 mi) | 2:10:23–2:14:36 (2023 & 2025 winners) | 12.8 mph · 12.28 mi · 276 ft gain · 148 bpm avg HR Current outdoor training baseline — not race effort | 2:20:00–2:25:00 (23.1–24.0 mph) | ≤2:15:00 (~24.9+ mph) |
| Run (13.1 mi) | 1:17:09–1:26:41 (2023 & 2025 winners) | TBD | 1:25:00–1:30:00 (6:29–6:52 per mi) | ≤1:20:00 (~6:06 per mi) |
| Transitions (T1 + T2) | — | TBD | 6:00 or less combined | 5:00 or less combined |
Historical is a real recorded M35–39 result at this race, not a target — 2023 was an unusually fast year and 2025 dropped the swim from official results, so its total isn't directly comparable (see the Race Benchmarks table below). Competitive and Podium are 3-year rolling targets, not a fixed pace plan.
What It Takes
The Competitive Ladder
Four performance tiers at this race, from a sub-5-hour finish up to the podium goal above.
AG winner (podium range)
4:05–4:16
- Swim
- 28–34m
- Bike
- 2:10–2:15
- Run
- 1:17–1:26
- Transitions
- ~5–7m
Competitive
4:15–4:25
- Swim
- 29–35m
- Bike
- 2:15–2:22
- Run
- 1:22–1:30
- Transitions
- ~6–8m
Top 5–10
4:25–4:40
- Swim
- 30–36m
- Bike
- 2:20–2:30
- Run
- 1:25–1:35
- Transitions
- ~7–9m
Sub-5 target
4:50–5:00
- Swim
- ~35–40m
- Bike
- ~2:35–2:40
- Run
- ~1:50–1:55
- Transitions
- ~8–10m
Race Day
The Course
What race day actually looks like — course details and cutoff times for each leg.
Swim
1.2 miles
Tennessee River
- Point-to-point
- Downstream
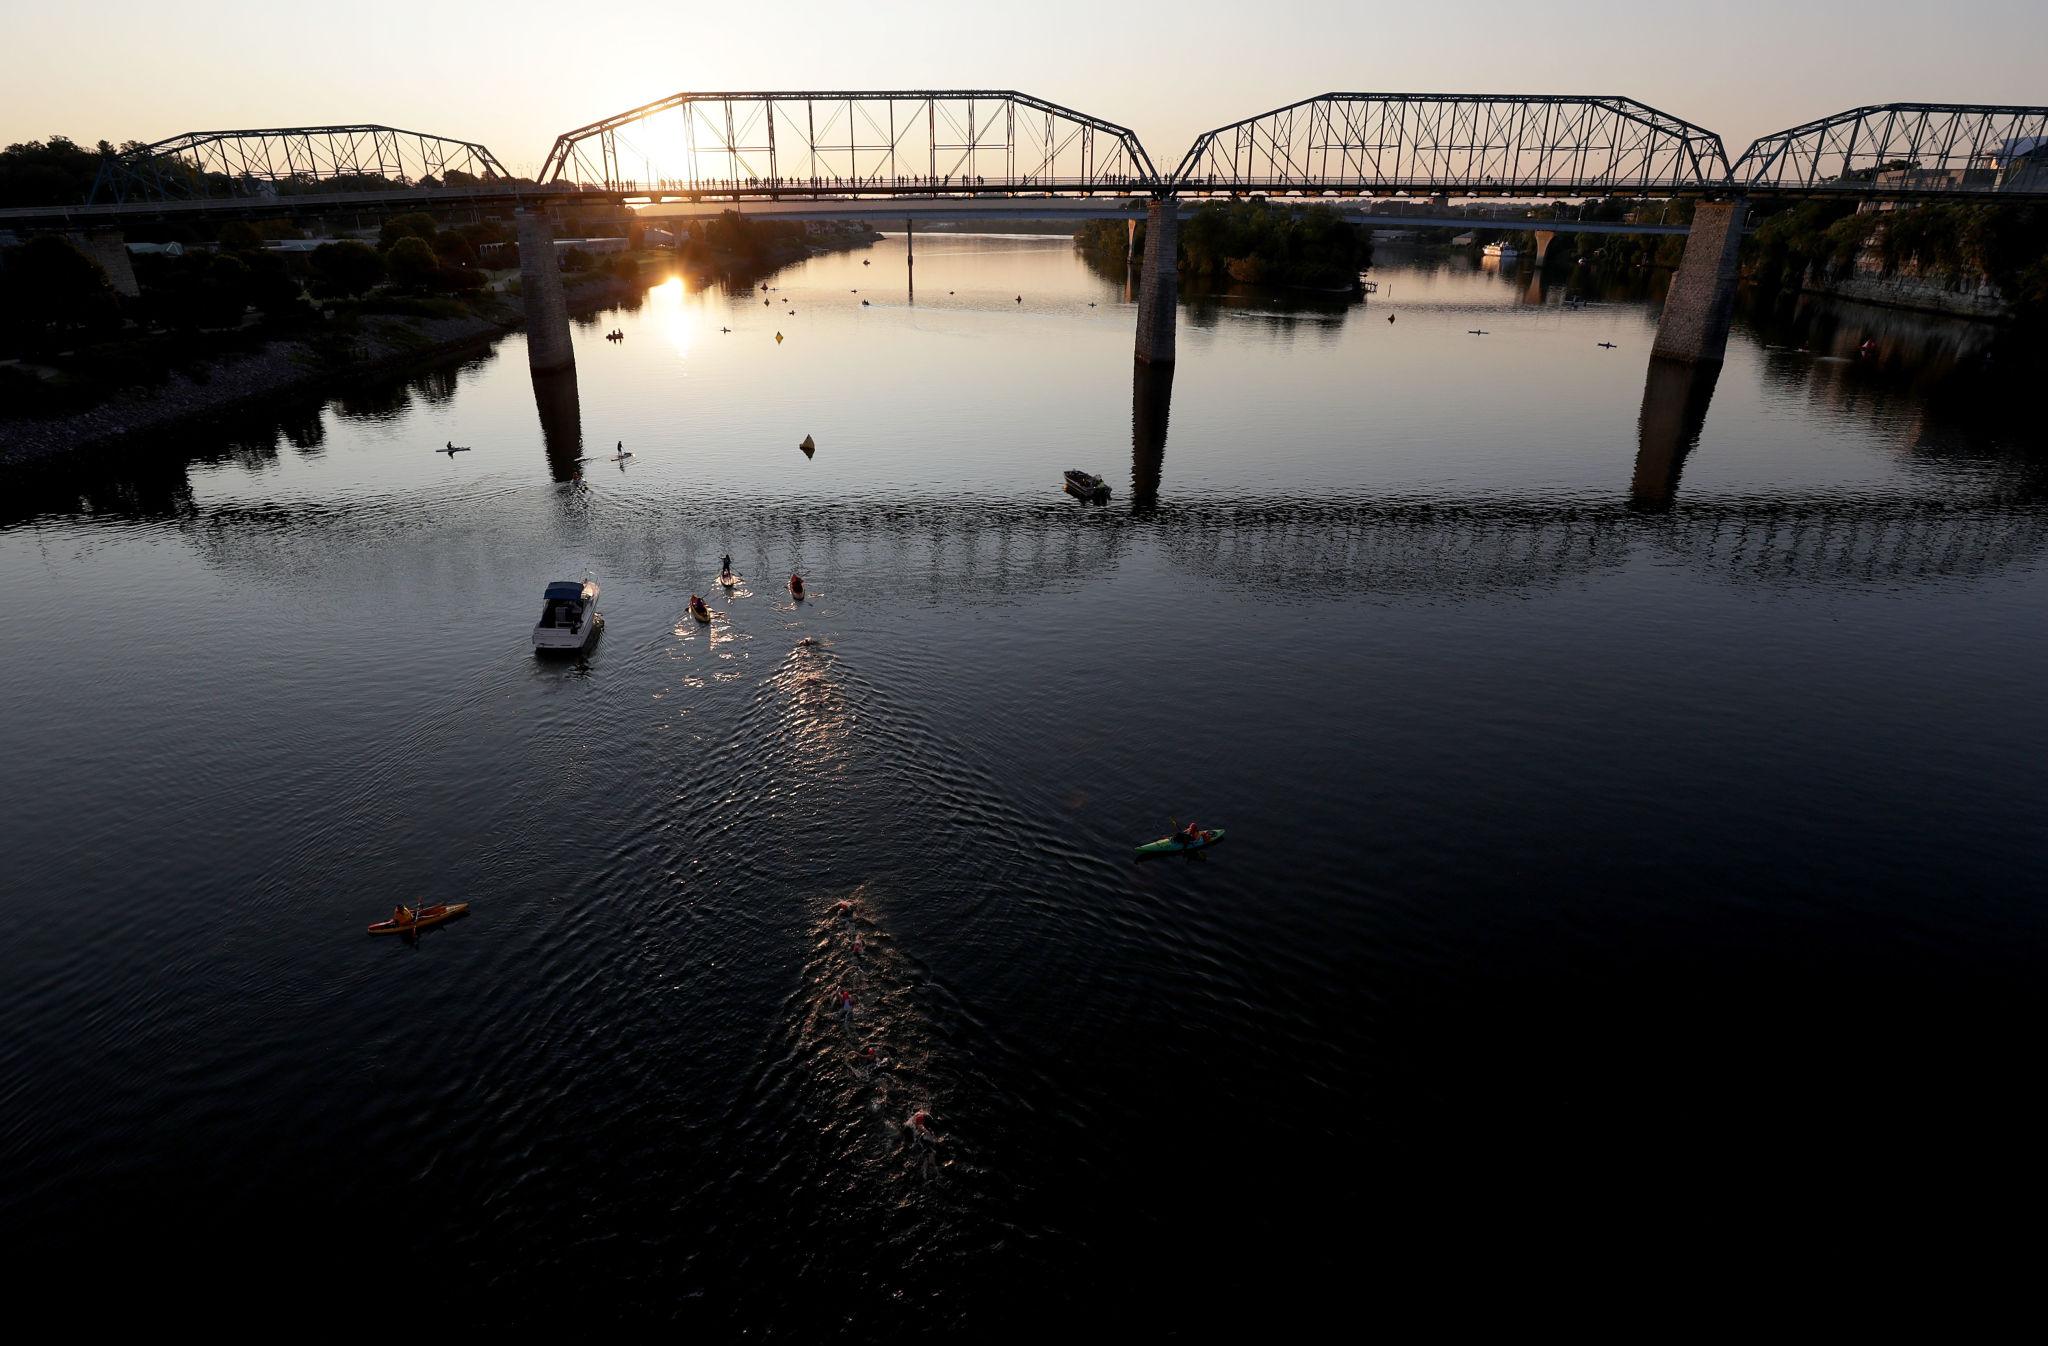
Point-to-point, downstream in the Tennessee River. Start is roughly 1.4 miles upriver of Ross's Landing; athletes exit at Ross's Landing Park.
- Cutoff
- 1:20 (from swim start)
Bike
56 miles
2,218 ft elevation gain
- Single loop
- Rolling terrain
- Repeated climbing through the central portion of the course
Single loop from Ross's Landing through St. Elmo, Highway 193, West Cove Road, and Chickamauga/Highway 341. Rolling terrain with repeated climbs from roughly mile 10 to mile 45 — no extended recovery sections.
- Mile 30.4 cutoff
- Mile 30.4 by 11:55 AM
- Overall race cutoff
- 5:30 (total elapsed race time)
- Aid stations
- Every 12–15 miles — water, hydration drink, gels, bars, bananas.
Run
13.1 miles
627 ft elevation gain
- Riverwalk
- Veterans Bridge
- Northshore
2.25-lap course along the Riverwalk, across Veterans Bridge, and through the Northshore neighborhood.
- Overall race cutoff
- 8:30 (total elapsed race time)
- Intermediate cutoff
- Mile 6.8
- Aid stations
- Roughly every mile — water, hydration drink, cola, gels, bars, fruit.
Race Weekend
The Schedule
Friday
2:00 PM–7:00 PMAthlete Check-InSaturday
9:00 AM–4:00 PMAthlete Check-In10:00 AM–5:00 PMBike Check-InSunday — Race Day
4:30 AM–6:15 AMTransition Access
Check-in is mandatory; there is no race-day check-in, and the bike stays racked in transition overnight. Based on recent-year race materials, not IRONMAN's own athlete guide for 2027 — confirm against the official athlete guide once published.
The Plan
Road to Chattanooga
- 1
Base
Build aerobic capacity, durability, and technique.
- 2
BuildCURRENT
Increase volume and discipline-specific workload.
- 3
Specific
Increase race-specific intensity, pacing, and terrain preparation.
- 4
Peak
Highest race-specific fitness and key simulation work.
- 5
Race
Toe the line and execute the plan.
Race
IRONMAN 70.3 Chattanooga
May 16, 2027
Training
Don't Let the Smile Fool You
A planned one-hour run got cut to 40 minutes after tight calves turned into Achilles soreness and foot numbness — a lesson in knowing when pushing through becomes counterproductive.
Training
Building the Engine: A Full-Body Strength Session
Full-body strength day — front squats, farmer's walks, and the unglamorous stabilizer work — the kind of session that builds the engine this bike still needs.
Training
Today, I Was Tired. So I Recalibrated.
Mental fatigue caught up with a pool session this morning — not a bad workout, just an honest one. On the difference between adjusting and quitting, and why finishing this campaign means more than checking a box.
Right Now
Current Training Status

Swim
1:52/100 yd
Fastest 100
Bike
143 W
FTP
Run
12:51/mi
Average Pace
See Full Training Data
Performance Trends
Real recorded benchmarks over time — not a full TrainingPeaks dashboard, just enough to show the direction things are moving.
Swim — Fastest 100 yd Pace
1:52/100 yd
September 8, 2026 → September 29, 2026 · 1:55/100 yd → 1:52/100 yd
Bike — FTP
143 W
Establishing baseline — recorded September 8, 2026.
Run — Average Pace
12:51/mi
September 9, 2026 → October 1, 2026 · 10:32/mi → 12:51/mi
VO2 Max
44
September 8, 2026 → September 22, 2026 · 41 → 44
Benchmarks
Milestones specific to this campaign's build toward 70.3 — not a record of lifetime athletic accomplishments. Nothing here is marked complete until it's actually done.
Updated October 1, 2026
Swim
1:58/100 yd
Repeatable 100 yd Pace
1:58.3/100 yd
Latest 10×100 Average
1:52/100 yd
Fastest 100
1:55–2:02
Latest Range
~2:04/100 yd
Previous Benchmark
2,400 yd
Session Distance
1:00:00
Session Duration
70
Session TSS
Prediction, not a completed test
133 bpm
Session Average HR
168 bpm
Session Max HR
627 kcal
Session Calories
Bike
143 W
FTP
151 W
20-Minute Average Power
167 bpm
FTP Test Average HR
76 rpm
FTP Test Average Cadence
Aerobic Fitness
44
Estimated VO2 Max
Latest Outdoor Ride
6.88 mi
Distance
30:20
Moving Time
13.6 mph
Average Speed
19.3 mph
Max Speed
54 ft
Elevation Gain
148 bpm
Average HR
158 bpm
Max HR
36
Relative Effort
32.1%
Zone 2
65.7%
Zone 3
97.8%
Combined Z2/Z3
78 W
Estimated Avg Power
Prediction, not a completed test
142 kJ
Energy Output
Prediction, not a completed test
86°F / Feels 91°F / 66% humidity
Conditions
Latest Outdoor Run
3.06 mi
Distance
39:21
Moving Time
12:51/mi
Average Pace
145 bpm
Average HR
165 bpm
Max HR
105 ft
Elevation Gain
9:00/mi
Fastest Mile Split
~8:10/mi
Tempo Pace (work intervals)
28:06 (prediction)
Strava Predicted 5K
Prediction, not a completed test
7:42
Timed Mile
27
Relative Effort
564 kcal
Calories
85°F / Feels 88°F / 56% humidity
Conditions
Platform-Calculated — TrainingPeaks
21
Fitness (CTL)
49
Fatigue (ATL)
-17
Form (TSB)
+3
7-Day Fitness Ramp Rate
TrainingPeaks baseline established September 2026. Fitness, Fatigue, and Form are still calibrating as training history accumulates — these are the platform's model of training load, not a direct physical measurement like the numbers above.
Road to Race Ready
16 / 84 Benchmarks
19%
Swim6 of 15Next: Complete CSS test: 400 yd + 200 yd
- 50 yd comfortable/repeatable
- 200 yd continuous
- 400 yd continuous
- 750 yd continuous
- 1,800 yd total sessionCurrent volume
- Establish repeatable 100 yd paceHistorical: ~2:04/100 ydCurrent: ~1:58/100 yd (10x100 avg 1:58.3, range 1:55-2:02)Race: Sub-1:20/100 yd (stretch target)
- Complete CSS test: 400 yd + 200 yd
- 8 × 100 yd within ±5 sec
- 1,000 yd continuous at aerobic effort
- 1,500 yd continuous with stable form
- 2,112 yd continuous
- Open-water 1,000 yd with sighting
- Full-distance open-water swim
- 1.2 mi race swim ≤32:00Historical: 28:19 (2023 M35–39 winner)Current: TBD
- Stretch-target swim ≤29:00Stretch Target
Bike3 of 18Next: Confident braking, shifting, cornering, descending
- Outdoor baseline: 9.06 mi / 12.1 mph / 412 ft
- Confident braking, shifting, cornering, descending
- 60 min continuous mostly Z2
- Establish repeatable benchmark route
- 14 mph benchmark at controlled HR
- 16 mph benchmark at controlled HR
- Install power meter
- Establish FTPCurrent: 143 W FTP (151 W / 167 bpm / 76 rpm 20-min test, Sept 2026)
- FTP ≥2.5 W/kg
- FTP ≥3.0 W/kg
- FTP ≥3.5 W/kg stretch targetStretch Target
- Hold aero position 20 min continuously
- Hold aero position 60 min without meaningful power loss
- 40 mi controlled with fueling executed
- 56 mi at planned race effort
- 56 mi + successful transition run
- 70.3 bike split ≤2:25 competitiveCompetitiveHistorical: 2:10:23–2:14:36 (2023 & 2025 M35–39 winners)Current: TBD
- Stretch-target bike split ≤2:15Stretch Target
Run1 of 16Next: Establish current 5K benchmark
- Establish aerobic HR/pace baselineCurrent: 10:32/mi avg pace @ 145 bpm avg HR (4.28 mi continuous, Sept 9)
- Establish current 5K benchmark
- Establish threshold pace
- 60 min Z2 with <5% HR/pace drift
- Sub-25:00 5K
- Sub-23:00 5K
- Sub-21:00 5K
- Sub-20:00 5K stretch targetStretch Target
- Controlled 10K at target training pace
- 10 mi aerobic without pace decay
- Open half marathon <1:40
- Open half marathon <1:30 stretch targetStretch Target
- 30 min off bike within 10% of fresh aerobic pace
- 60 min off bike with stable HR and pace
- 70.3 run ≤1:30 competitiveCompetitiveHistorical: 1:17:09–1:26:41 (2023 & 2025 M35–39 winners)Current: TBD
- Stretch-target 70.3 run ≤1:20–1:25Stretch Target
Brick0 of 8Next: First bike → run transition
- First bike → run transition
- 60 min bike + 15 min run with smooth transition
- 90 min bike + 30 min run with run pace within 10% of fresh aerobic pace
- 2 hr bike + 30 min run with fueling executed correctly
- 3 hr bike + 45 min run with no major pace decay
- Race-specific brick at projected bike and run effort
- Race-simulation brick with full fueling, transitions, and aero execution
- Race simulation completed with <5–7% late-session fade
Supporting Fitness Indicator — VO₂ Max5 of 7Next: 45
- 37One month ago
- 38Two weeks ago
- 40One week ago
- 41Recently
- 42Current
- 45
- 50
Hybrid Strength0 of 6Next: Establish Phase 2 strength baselines
- Establish Phase 2 strength baselines
- Track bench/push, pull-up or pulldown, row, overhead press, hinge/RDL, and split squat/leg press
- Maintain ≥90% of baseline strength as endurance volume rises
- Complete 2 strength/cross-training sessions per week for 8 consecutive weeks
- Maintain muscular body composition
- No endurance-session degradation caused by strength programming
Race Readiness1 of 14Next: Full-distance pool swim complete
- Full-distance pool swim complete
- Full-distance open-water swim complete
- 56 mi bike complete at controlled race effort
- 13.1 mi run complete aerobically
- Race fueling plan validated for 3+ hr
- Aero position sustainable for race-duration blocks
- Transitions rehearsed
- Wetsuit/open-water competency established
- Full race-simulation brick completed
- Full-distance swim at target race pace
- 56 mi bike at target race effort
- 60 min post-bike run at target race effort
- Stretch-target overall capability: ~4:05–4:15Stretch TargetHistorical: 4:04:51–4:27:25 (2023 top-9, M35–39); 2025 not directly comparable — no swim leg heldCurrent: TBD
- IRONMAN 70.3 Chattanooga completed
Today's Recovery
92%
Recovery
81%
Sleep Performance
0.3
Day Strain
Latest Session
Activity
October 6, 2026
12m
Strain 4.8
View Training Details ↓
Hiit
October 6, 2026
1h 4m
Strain 14.8
Walking
October 2, 2026
16m
Strain 4.4
Dance
October 2, 2026
28m
Strain 4.1
Running
October 1, 2026
41m
Strain 9.8
Training data via WHOOP. Last updated October 7, 2026.
Road to 70.3
31
Weeks to Race
The Competition
Times to Beat
M35–39 age-group results at IRONMAN 70.3 Chattanooga, 2022–2026 — the real numbers behind the goal above.
Recent M35–39 Winning Performances
- 2022—4:06:33
- 2023—4:04:51
- 2025—shortened race
- 2026—4:16:00
Recent normal-format years show M35–39 podiums finishing in the 4:05–4:16 range — the goal target above reflects that real result, not a softer estimate.
2026 Top 5 Results
The most recent normal-format race — 218 M35–39 finishers. The winner wasn't the fastest swimmer; the gap opened on the bike and run.
| Place | Swim | Bike | Run | Finish |
|---|---|---|---|---|
| 1 | 33:36 | 2:10:14 | 1:25:34 | 4:16:00 |
| 2 | 29:30 | 2:15:27 | 1:26:55 | 4:17:26 |
| 3 | 32:14 | 2:21:00 | 1:25:20 | 4:24:08 |
| 4 | 35:22 | 2:18:52 | 1:29:04 | 4:29:38 |
| 5 | 30:57 | 2:25:11 | 1:26:29 | 4:30:09 |
2025 Shortened-Race Results
No swim leg was held (river conditions), so finish times aren't comparable to a normal-format year — bike and run splits are, though, and are kept here for that reason.
| Place | Swim | Bike | Run | Finish |
|---|---|---|---|---|
| 1 | — | 2:10:23 | 1:26:41 | 3:39:31 |
| 2 | — | — | — | 3:42:48 |
| 3 | — | — | — | 3:44:53 |
2023 Historical Results
An unusually fast year for the division — 9th place finished in 4:27:25, and even 10th place finished in 4:33:11.
| Place | Swim | Bike | Run | Finish |
|---|---|---|---|---|
| 1 | 28:19 | 2:14:36 | 1:17:09 | 4:04:51 |
| 2 | 27:17 | 2:23:45 | 1:18:07 | 4:13:59 |
| 3 | 28:37 | 2:17:51 | 1:24:33 | 4:16:14 |
| 4 | 26:30 | 2:13:47 | 1:31:22 | 4:17:55 |
| 5 | 27:20 | 2:24:42 | 1:23:12 | 4:21:38 |
Additional Historical Results
2026 top-5% finish-time threshold for M35–39: 4:48:18 — an intermediate benchmark between “sub-5” and the front of the division.
M35–39 Winning Time, by Year
| Year | Swim | Bike | Run | Finish |
|---|---|---|---|---|
| 2026 | 33:36 | 2:10:14 | 1:25:34 | 4:16:00 |
| 2025 | — | 2:10:23 | 1:26:41 | 3:39:31 |
| 2024 | — | — | — | — |
| 2023 | 28:19 | 2:14:36 | 1:17:09 | 4:04:51 |
| 2022 | 28:07 | 2:13:44 | 1:19:32 | 4:06:33 |
- 2025: No swim leg held (river conditions) — not comparable to a normal-format race.
- 2024: Unconfirmed — full results not yet verified.
Benchmark Methodology
Compiled from age-group results for the 2022–2026 races — real recorded results, not projections, except where marked unconfirmed above.
Deliberately anonymous: this is about the times, not putting other amateur athletes' names on a public campaign page, so no winner/finisher names are stored or rendered here.
2025 is excluded from time comparisons — no swim leg was held that year (river conditions), so total times aren't comparable to a normal-format race. It's kept in the yearly table only for continuity, clearly flagged.
The performance tiers (see the ladder above) are a composite across the normal-format years only — 2022, 2023, and 2026. “AG winner” is labeled “(podium range)” because that's what the 2023 and 2025 results actually show: recent podiums here run closer to age-group-winner pace than a softer “podium contender” estimate would suggest.
The Equipment
Building the Bike, Dialing In the Gear
Cycling is the newest discipline here, and it started without a bike at all. The full stories of getting one race-ready — and everything else in the kit, from wetsuit to running shoes — live in their own ongoing series in the Journal.
Latest Bike-Build Update · October 5, 2026
Another Setback
The front derailleur didn't make it through the mail this past weekend, so final assembly is still on hold — it's expected to arrive today.
Read the Full Story →Latest Gear-Journey Update · August 28, 2026
The Gear Journey: The Cost of Getting to the Starting Line
One of the things I underestimated when I decided to enter triathlon was just how high the barrier to entry can be. Not physically. I expected that part.
Read the Full Story →Follow the Training
Race prep, training milestones, and fundraising updates are posted as the campaign progresses.
70.3 Is the Distance.
The Mission Is Bigger.
The $70K Mission
One Goal. Multiple Campaigns. One Mission.
raised
Goal: $70,000
70.3 miles · May 16, 2027